Autosomal Dominant Inheritance
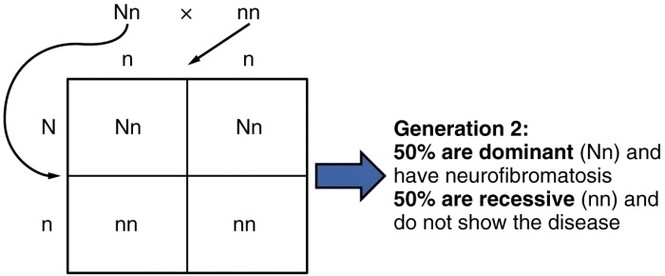
Autosomal Dominant Inheritance: In autosomal dominant inheritance, a single copy of a mutated gene on a non-sex chromosome is sufficient to cause a genetic disorder, which can be passed from just one affected parent.